Logtrail to tail log with Elasticsearch & Kibana on Kubernetes
June 1, 2018
Monitoring and Logging are important aspects of deployments. Centralized logging is always useful in helping us identify the problems.
EFK (Elasticsearch, Fluentd, Kibana) is a beautiful combination of tools to store logs centrally and visualize them on a single click. There are many other open-source logging tools available in the market but EFK (ELK if Logstash is used) is one of the most widely used centralized logging tools.
This blog post shows how to integrate Logtrail which has a papertrail like UI to tail the logs. Using Logtrail we can also apply filters to tail the logs centrally.
As EFK ships as an add-on with Kubernetes, all we have to do is deploy the EFK add-on on our k8s cluster.
Pre-requisite:
-
Access to working kubernetes cluster with kubectl configuration.
-
All our application logs should be redirected to STDOUT, so that Fluentd forwards them to Elasticsearch.
-
Understanding of Kubernetes terms like pods, deployments, services, daemonsets, configmap and addons.
Installing EFK add-on from kubernetes upstream is simple. Deploy EFK using following command.
$ kubectl create -f https://raw.githubusercontent.com/kubernetes/kops/master/addons/logging-elasticsearch/v1.6.0.yaml
serviceaccount "elasticsearch-logging" created
clusterrole "elasticsearch-logging" created
clusterrolebinding "elasticsearch-logging" created
serviceaccount "fluentd-es" created
clusterrole "fluentd-es" created
clusterrolebinding "fluentd-es" created
daemonset "fluentd-es" created
service "elasticsearch-logging" created
statefulset "elasticsearch-logging" created
deployment "kibana-logging" created
service "kibana-logging" created
Once k8s resources are created access the Kibana dashboard. To access the
dashboard get the URL using kubectl cluster-info
$ kubectl cluster-info | grep Kibana
Kibana is running at https://api.k8s-test.com/api/v1/proxy/namespaces/kube-system/services/kibana-logging
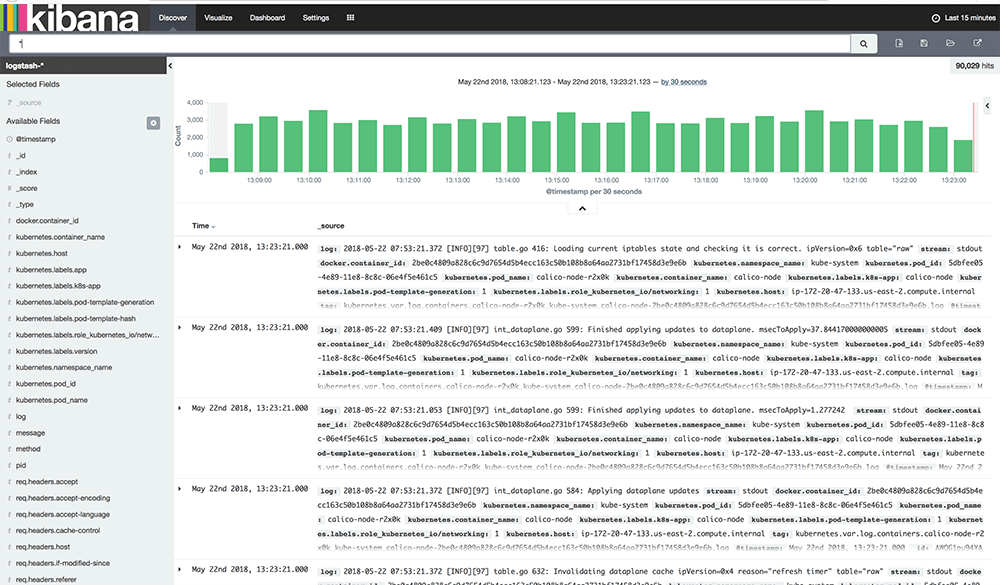
Now goto Kibana dashboard and we should be able to see the logs on our dashboard.

Above dashboard shows the Kibana UI. We can create metrics and graphs as per our requirement.
We also want to view logs in tail style. We will use
logtrail to view logs in tail format.
For that, we need docker image having logtrail plugin pre-installed.
Note: If upstream Kibana version of k8s EFK add-on is 4.x, use kibana 4.x image for installing logtrail plugin in your custom image. If add-on ships with kibana version 5.x, make sure you pre-install logtrail on kibana 5 image.
Check the kibana version for add-on here.
We will replace default kibana image with kubernetes-logtrail image.
To replace docker image update the kibana deployment using below command.
$ kubectl -n kube-system set image deployment/kibana-logging kibana-logging=rahulmahale/kubernetes-logtrail:latest
deployment "kibana-logging" image updated
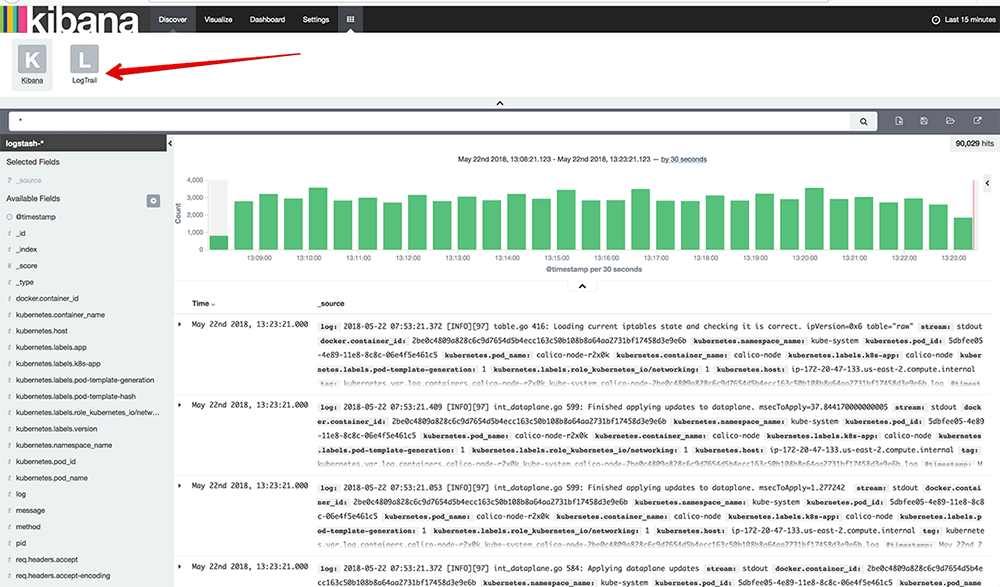
Once the image is deployed go to the kibana dashboard and click on logtrail as shown below.

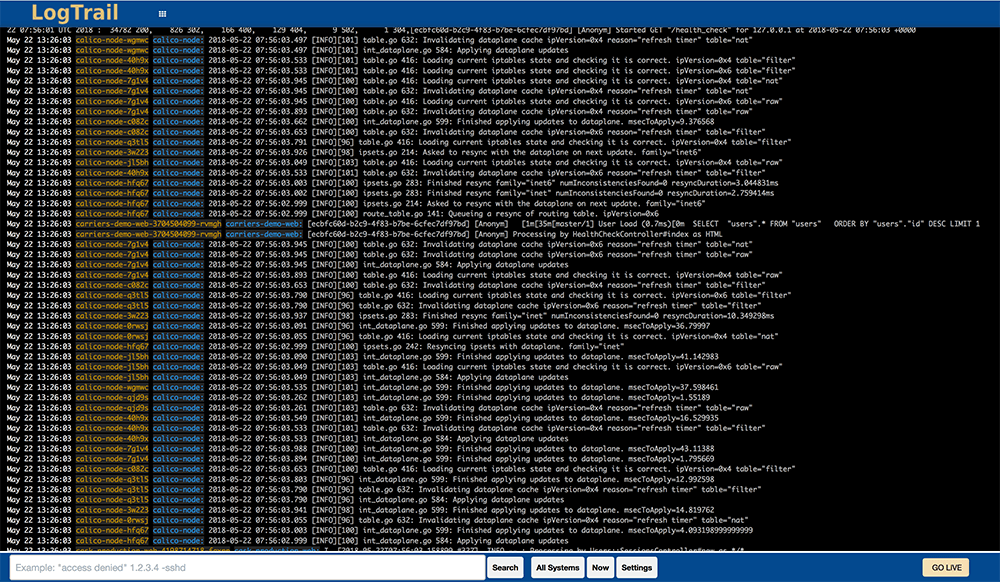
After switching to logtrail we will start seeing all the logs in real time as shown below.

This centralized logging dashboard with logtrail allows us to filter on several parameters.
For example let's say we want to check all the logs for namespace myapp. We
can use filter kubernetes.namespace_name:"myapp". We can user filter
kubernetes.container_name:"mycontainer" to monitor log for a specific
container.
Follow @bigbinary on X. Check out our full blog archive.